Trendline Trading Strategy: 3 Simple Steps To Improve Profitability
The trendline trading strategy is one of the most commonly mentioned trading concepts, but how do you actually use these trend lines to improve your profitability as a trader?
Day Trading 101: What Are Trend Lines?
Trendlines are visual representations that show the direction and speed of price and also describe patterns during periods of price contraction.
They can be a simple yet useful way to identify the direction of the price and the short-term sentiment, whether it's moving up, down, or consolidating sideways. So the trendlines can be upward or downward-sloping, or horizontal lines drawn manually on charts.
Some traders also use indicators such as moving averages or RSI to identify trend lines.
Why do you need trendlines?
Not only do trendlines give us information about the direction, but they also act as support and resistance levels in trading.
Traders can also use them to determine the entries and exits and adjust the price targets based on how the stock is reacting to various trend lines.
How to Draw Trendlines Tip #1: Look for higher highs and higher lows.
When identifying uptrends, you want to look for a higher high and a higher low. So what does that look like on the Tesla stock chart here on the daily chart?
You can see from the charts below that the price was kind of consolidating in this range during this period.
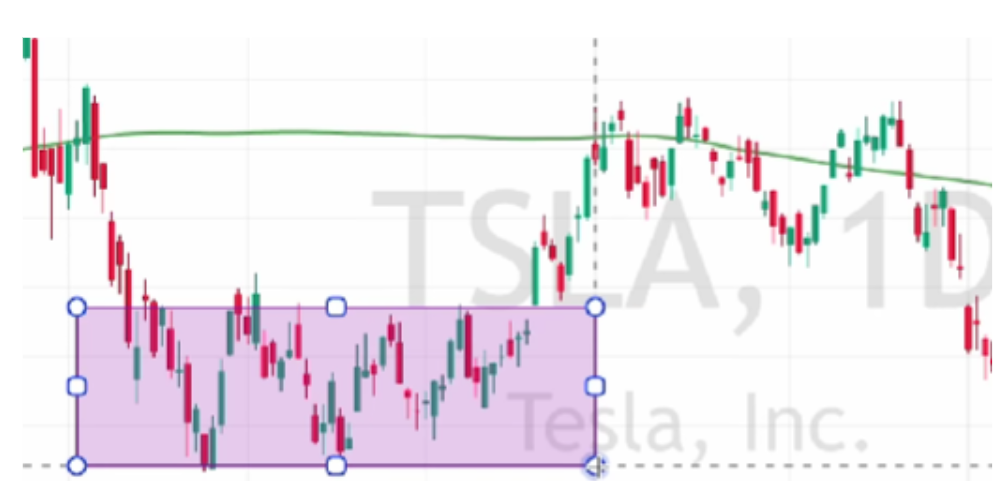
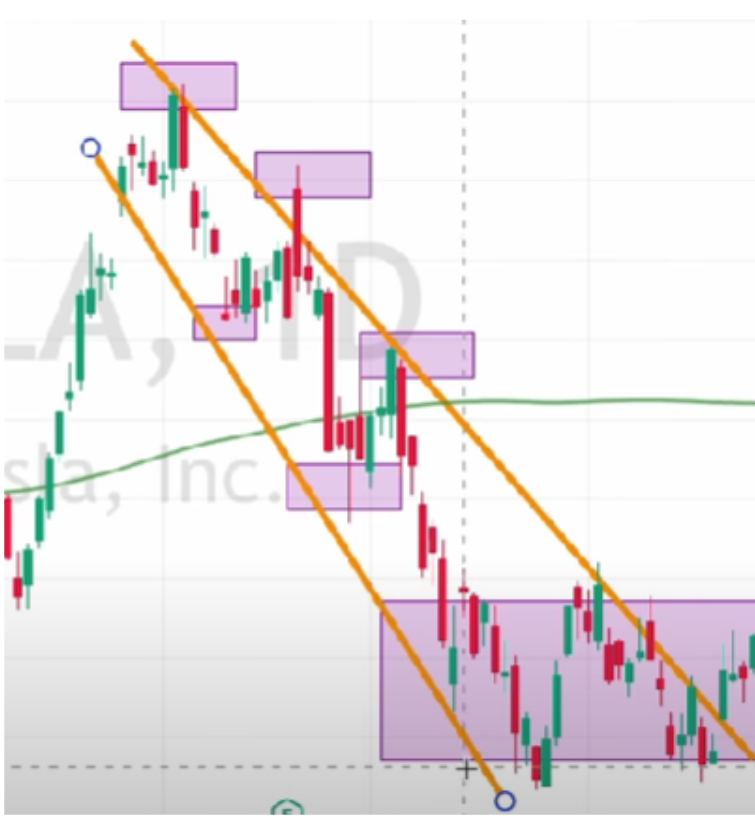
Step 1: Look for a breakout from consolidation.
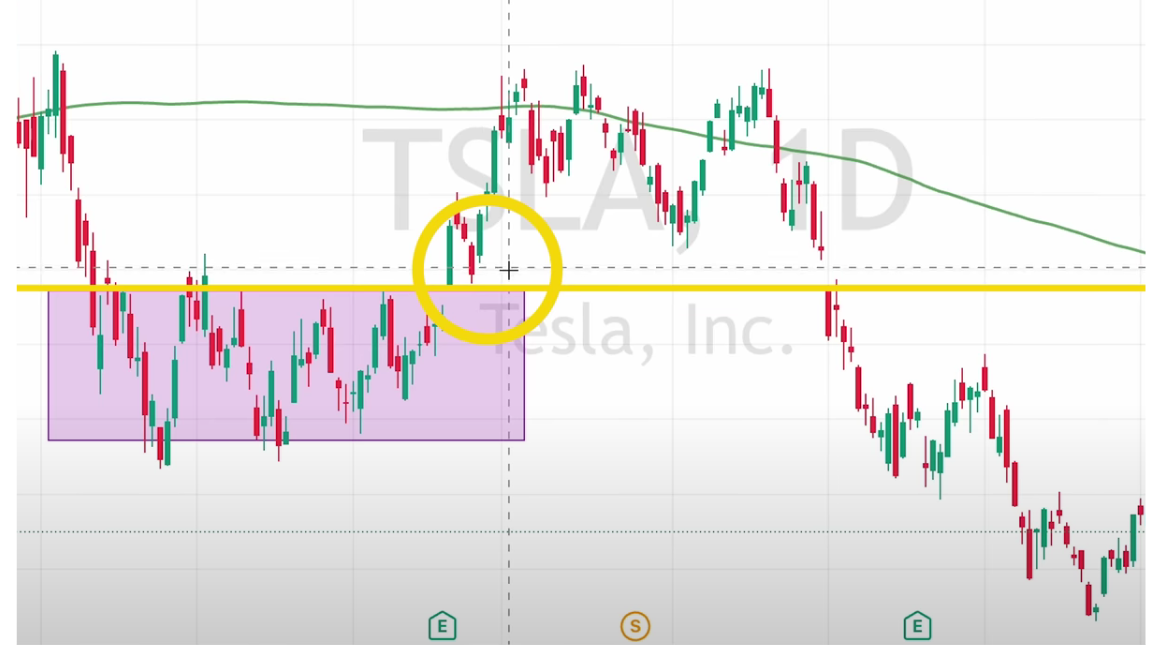
You can see that once the stock breaks out of this range in this box, it has a higher low (the lowest candle in the circle) than the highs in the previous range (the purple box). So, a breakout is formed.
Step 2: Connect higher lows and higher highs
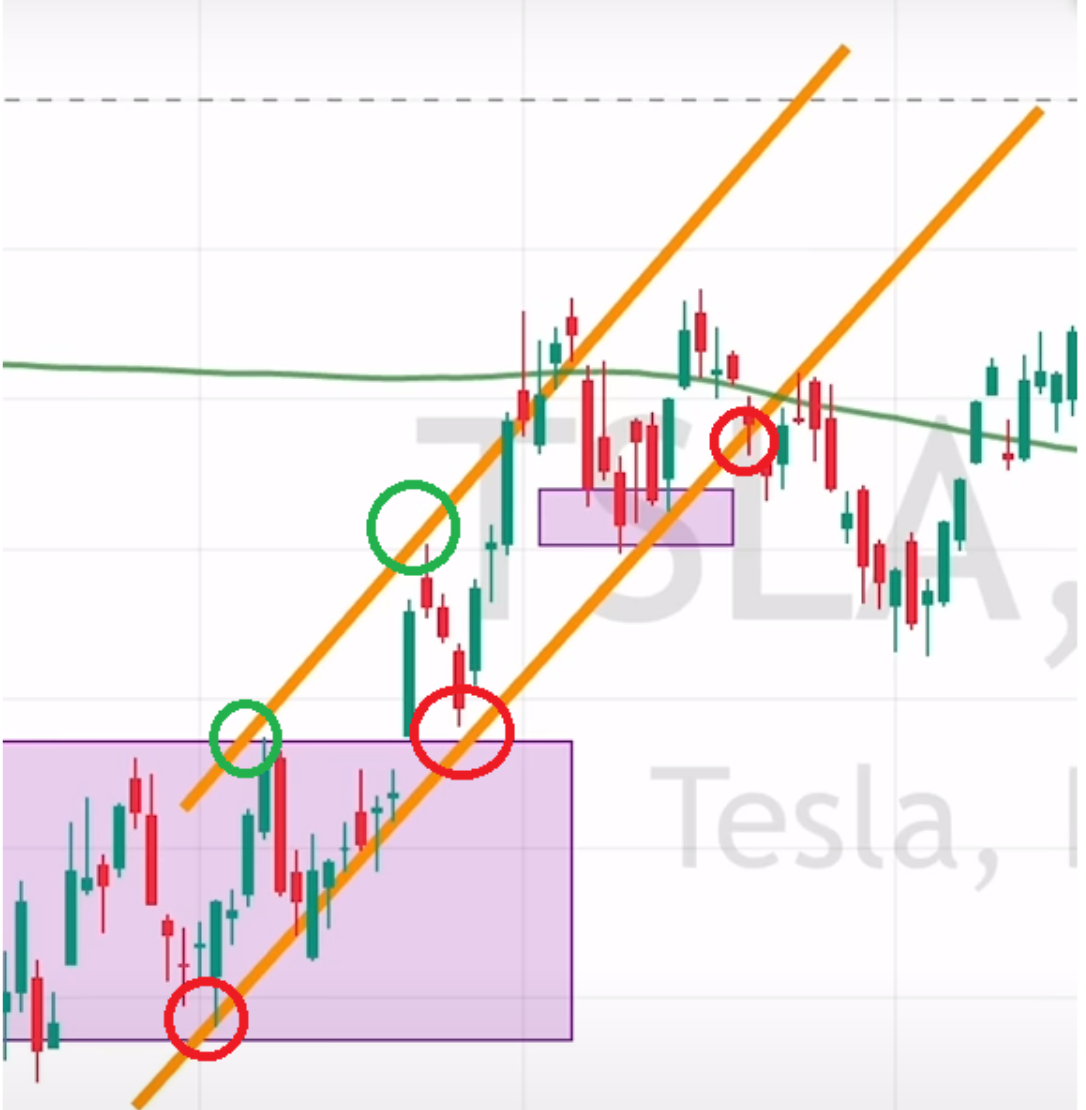
After the breakout, you might find out the lower lows (the red circles) and the higher highs (the green circles). Once you connect the lower lows and the higher highs, you have drawn upward trendlines! Congratulations!
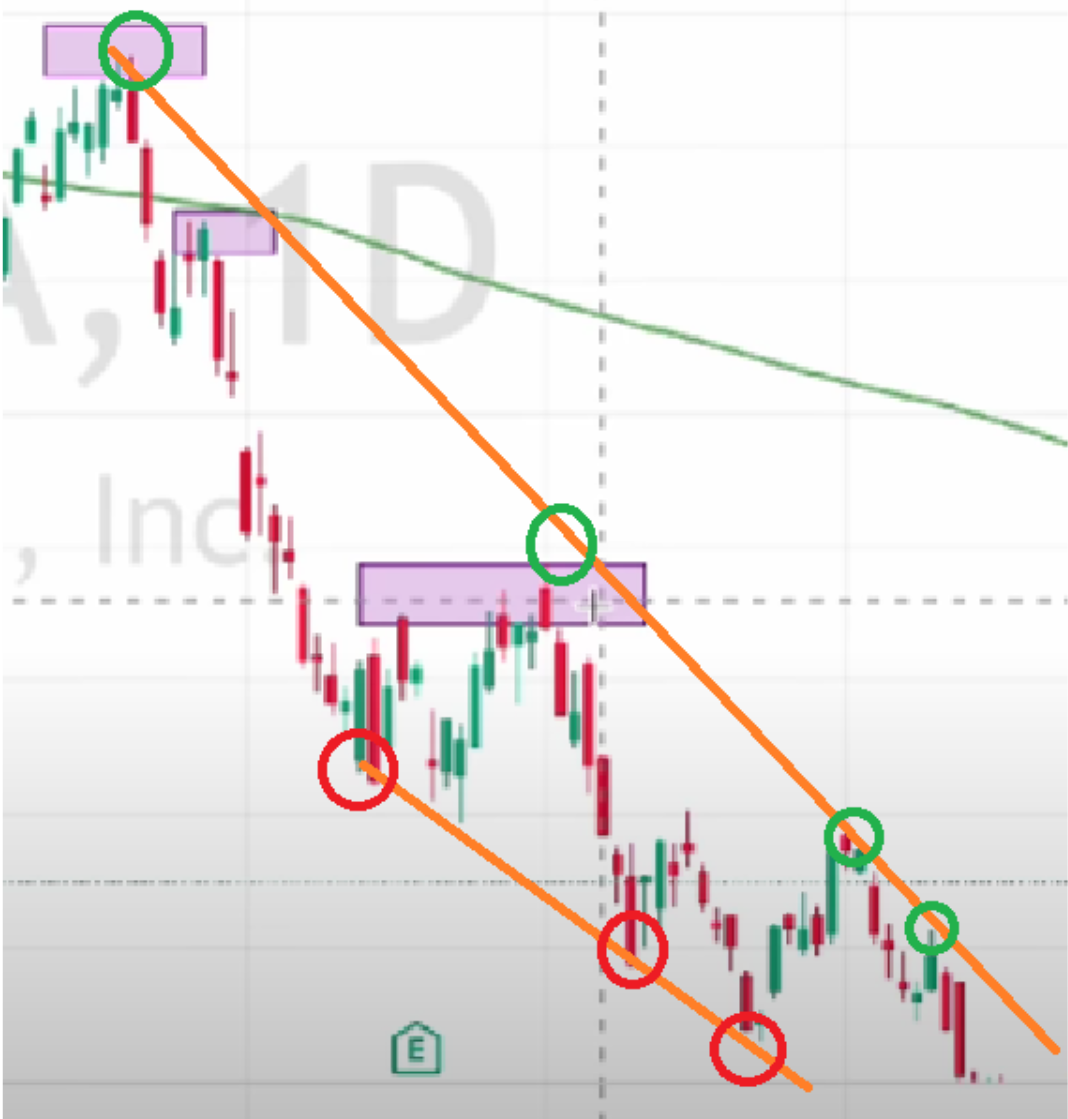
Now we can do something similar with the downtrend as well.
The downtrends are usually followed by lower lows (red circles) and lower highs (green circles), once you connect the circles, you’ll have the downward trendline.
How to Draw Trendlines Tip #2: Look for a minimum of three contact points.
The second tip I have for you when drawing trend lines is that you want to make sure there are at least 3 contact points. In fact, you want to see as many as possible on the chart.
Looking at a Tesla example here, you can see the 4 contact points for the slide, so that's a clear downtrend formed.
Remember, you want to see as many contact points on the daily candles as possible when you're drawing trend lines on the daily chart now.
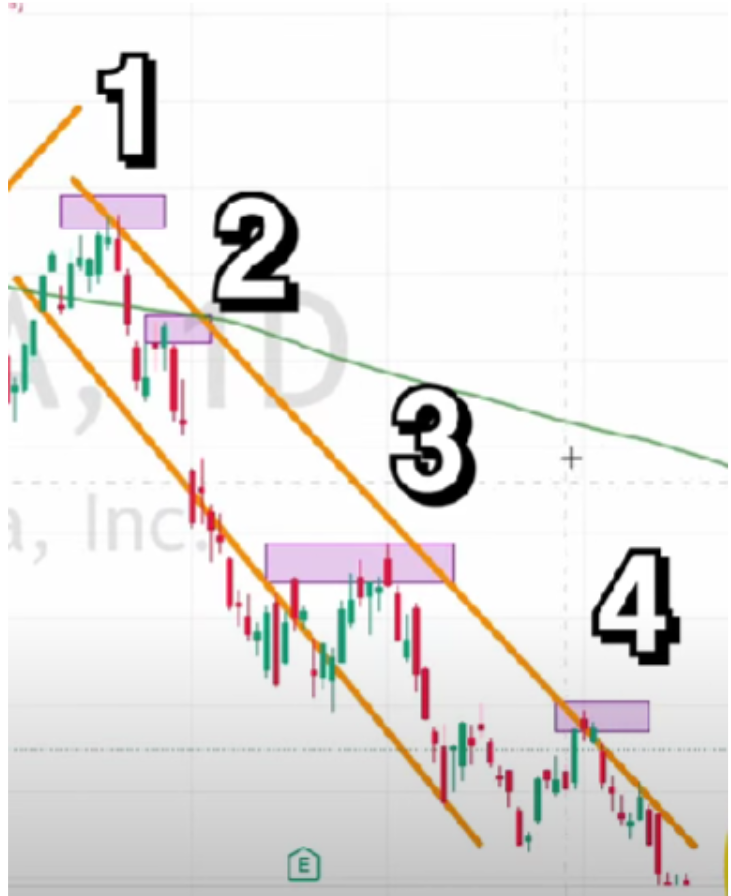
How to Draw Trendlines Tip #3: Look for Extreme Highs and Extreme Lows
You want to look for extreme highs and extreme lows when you are drawing trend lines. What do extreme highs and lows mean? On the daily chart, look for candles either breaking out or breaking down that stand out with a v-shaped rebound.
In the example on this Tesla's chart, you can see the extreme highs and lows rebound in the purple boxes.
When you line up all the extreme highs and extreme lows, you get another downtrend with Tesla stock.
Charting Tip: You can apply the same principles to intraday charts, regardless of whether they are 4-hour, 1-hour, 30-minute, 15-minute, 5-minute, or even the weekly chart.
My Trendline Trading Strategy for Large Caps
Now that you know how to read the lines and even draw the trend lines on your charts, all you need is a strategy. Here’s my trading strategy that I personally use to trade large-cap stocks such as Tesla, Nvidia and many others.
I'm going to demonstrate this trendline strategy in two different scenarios: one is a downtrend continuation, while the other is a downtrend breakout.
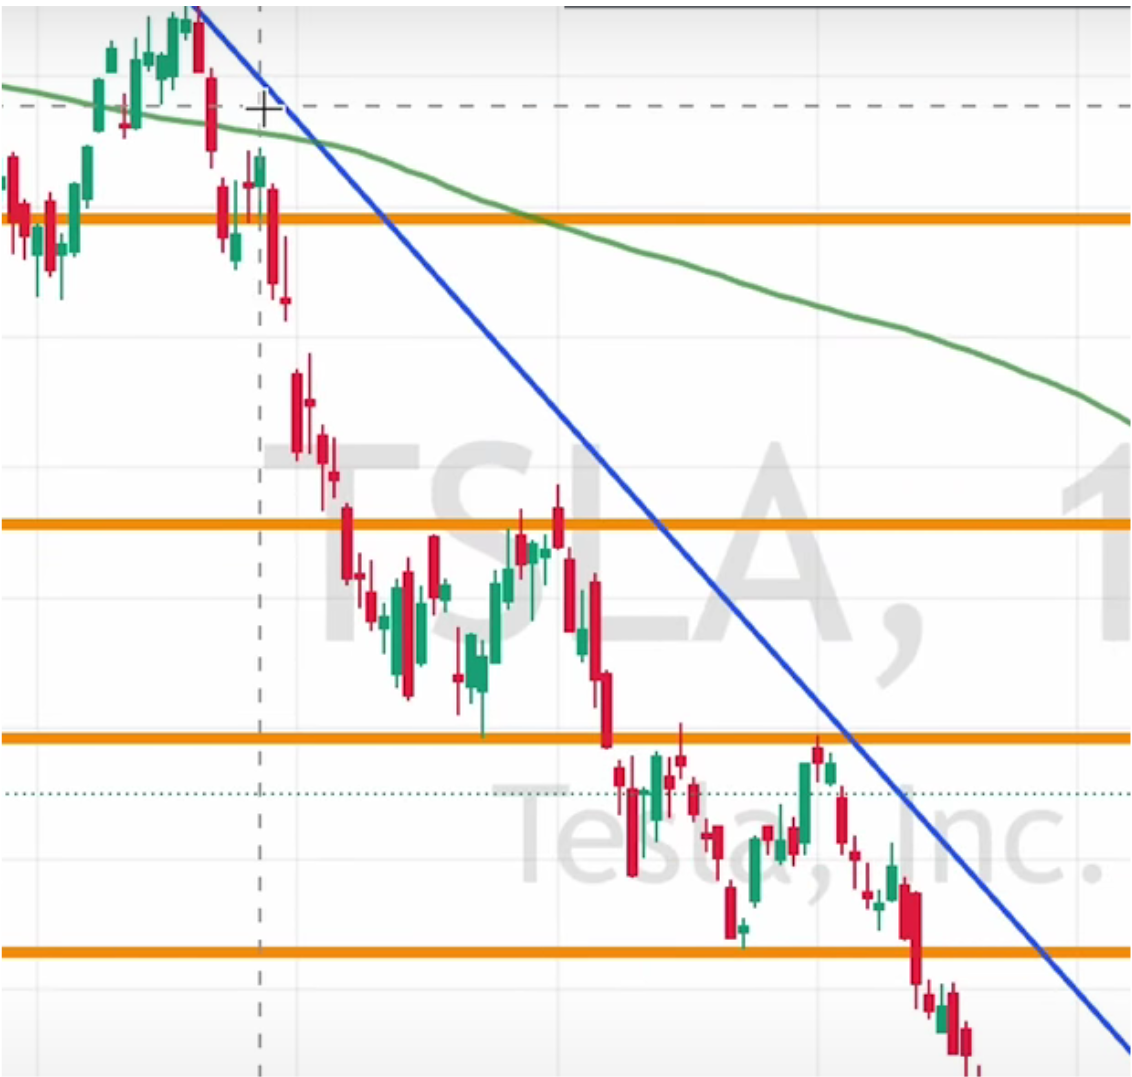
Tesla Example: Downtrend Continuation
Going back to Tesla stock on the daily chart, you can see that this stock has pretty much been down-trending since 2022, and the price was expected to move under the blue line and continue the downtrend.
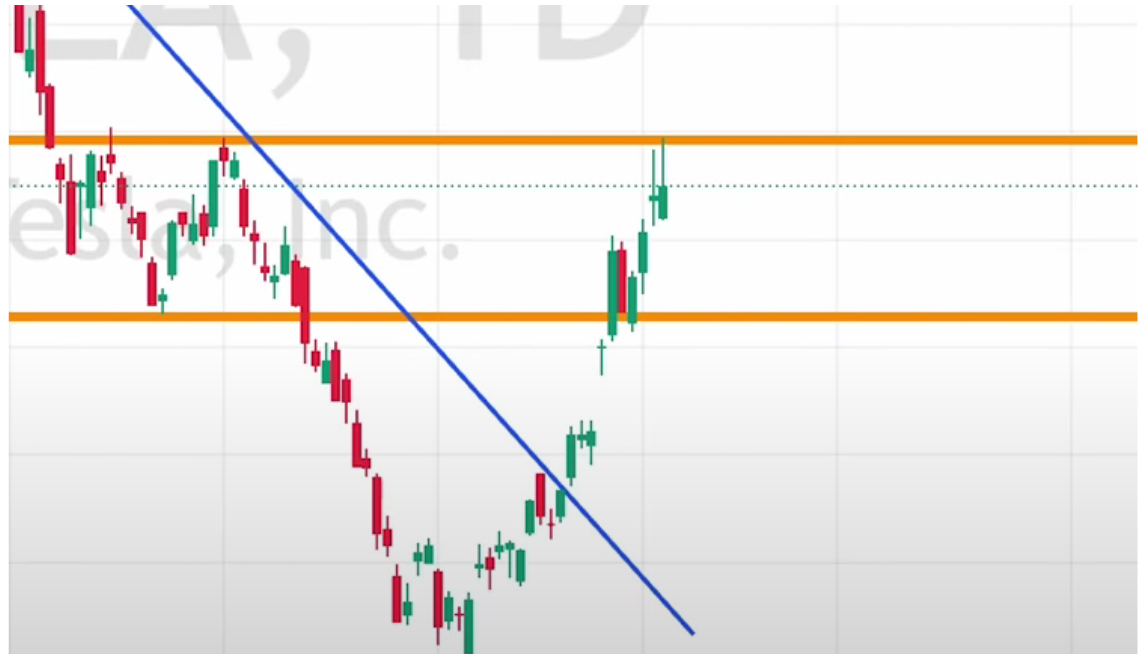
Tesla Example: Downtrend Breakout
Once again, when the stock breaks out of this previous downtrend over here, you can expect a new trend to form.
The breakout can result from unexpected positive news like surprisingly good company’s earnings, a new technology release, or other possible catalysts.
If you’re looking for uptrend examples, remember to check out the Youtube video!
Bonus Tips:
Here are some bonus tips! When it comes to the trendline trading strategy, here's what you should avoid based on my own personal experience after trading for more than 8 years.
Tip #1: Always follow the trend.
The trend is always your best friend. Always zoom out on the daily chart or the weekly chart to check out the supply and resistance. That's how you see the bigger picture for your stock's direction and use that to your advantage in trading.
Tip #2: Technical analysis is subjective
Don’t over-interpret the stocks that you draw because technical analysis does not have to be perfect.
Remember, technical analysis can be extremely subjective. You can see a downtrend on the daily chart as a swing trader, but another trader who is an intraday scalper can actually see an uptrend for a long trade.
Tip #3: Different traders may have different perspectives.
Depending on the time horizon, trading style, and different strategies, different traders may have different perspectives.