Penny Stock Strategy Playbook: Tips for Successful Trading
You've probably heard all about penny stock trading from "the trading gurus," and you're all set to earn your Lamborghini! Well, before you hit the pedal, here's a handy penny stock strategy playbook that can help boost your success rate.
Coming up, I'm going to delve into the nitty-gritty of market psychology analysis and VWAP trading strategies. Stick around for more exciting insights!
Penny Stock Trading Strategy: Market Psychology Analysis
To begin to earn profits, market psychology analysis in penny stock trading can be the first thing to understand. As the legendary Chinese strategist Sun Tzu’s saying goes, “If you know the enemy and know yourself, you need not fear the result of a hundred battles.”
In a market analysis, we must think for the other buyers and sellers, and understand what the players are thinking.
The most common players in the penny stock market are:
break-out traders,
momentum traders,
dip buyers,
short sellers, and
swing traders.
I will be breaking down the basics of trader psychology in the market. So you will be able to analyze and profit from day trading beyond just memorizing patterns and strategies.
Penny Stock Market Psychology Analysis: Breakout Traders
The first one we will go over is the breakout traders. These are the traders who buy into a penny stock when it’s at the point of breaking a previous high.
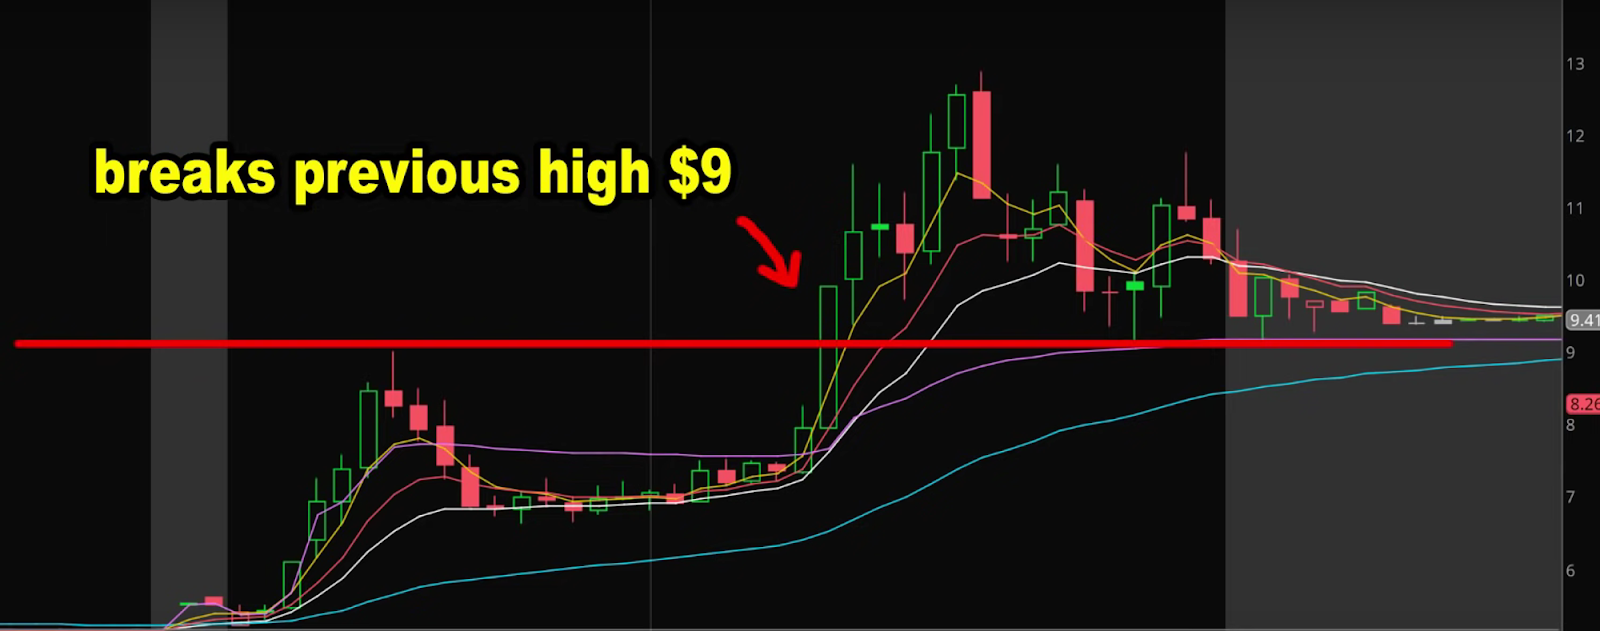
Let’s look at the $ABIO intraday chart here.
On this day, the stock got pumped up by PR and traded as high as $9 from $5 in the morning session. It sold off a little bit mid-day and retested the previous high in the afternoon.
Breakout traders anticipate that at the retest price, the stock may make a new high, potentially surpassing $10. This triggers increased trading volume as more buyers join, pushing the price from $9 to almost $13.
Breakout traders often follow the most predictable patterns, as this is the most frequently taught strategy in penny stock day trading courses, DVDs, and chat rooms. This strategy is also commonly referred to as the "breakout pattern" or "U-shape pattern."
Penny Stock Market Psychology Analysis: Momentum Traders
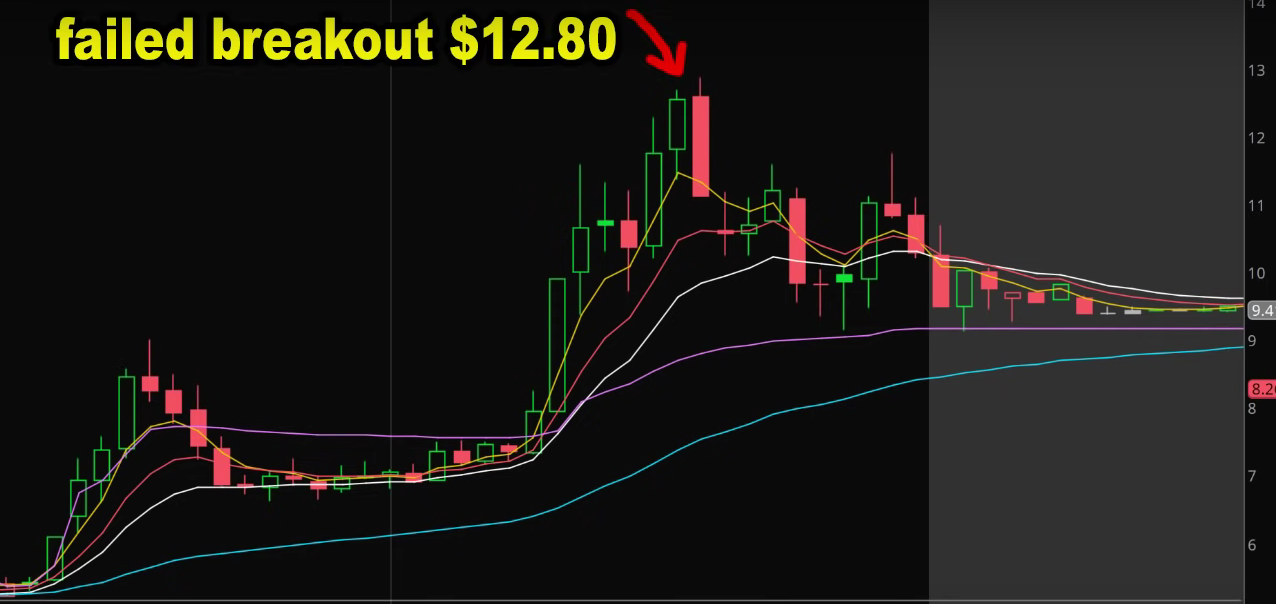
Once all the traders watching $ABIO see that the stock has just made a new high, breaking above the previous resistance of $8.95, this is where the momentum traders get interested. Momentum players think: "The $ABIO breakout worked. Stocks often gain more volume after breaking the previous day’s highs. So, I should invest in strength!” These momentum traders hop in along with the breakout traders. That's why, most times, when penny stocks break a previous resistance with strong volume, the price will squeeze even higher. Remember this: Momentum traders buy into strength. However, when that strength weakens, they sell their positions and exit their trades.
You can see it right here on the chart. The breakout traders who got in to break the previous high of $12.69 failed. The stock only went twenty cents higher at $12.88 and quickly slammed back down to $11.
Penny Stock Market Psychology Analysis: Short Sellers
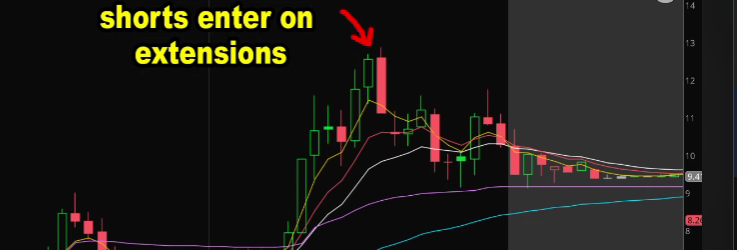
Short sellers, who detect selling increases and buying decreases in stock volumes and levels, favor overly extended stocks like $ABIO. Noticing a slowdown in buying, they anticipate increased selling and aim to short the stock.
When a short squeeze happens
Impatient short sellers often enter the market early, shorting everything on the rise. They might short-sell at $7, $8, despite the previous high of $9.
When the stock breaks $10, early short sellers panic, thinking, "I didn't expect this. The breakout didn't fail as I predicted. If it reaches $20 or $30, my account could be ruined. I better exit now.
So the short sellers who are in pain decide to get out. And they need to buy cover to get out. That causes a short squeeze.
When short sellers succeed
Let's return to successful short sellers. If I were a short seller who shorted at $12.80, and now the stock is back down at $9, I would start covering a portion around this $9 level. Why? They understand that dip buyers are likely to start entering the market.
Penny Stock Market Psychology Analysis: Dip Buyers

The fourth type of trader to consider refers to "dip buyers”, who purchase stocks after they've peaked and returned to a previous support level. They prefer entering the market on pullbacks following strong upward trends. Dip buyers eye the $9 level, noting the previous trade at $12. They see $9 as a reasonable buy-in, taking the previous resistance level as a new support.
Simultaneously, short sellers consider the same level, are wary of dip buyers stepping in, and start to cover. This balance of actions among traders forms the support and resistance levels.
The stock bounces from $9 to $11.70 as dip buyers and short sellers buy. And this bounce pattern only happened because dip buyers and shorts came in to buy.
Penny Stock Market Psychology Analysis: Swing Traders
The fifth major player is swing traders, who buy strong stocks overnight, expecting the price to increase. They think, "This is day one of the move on $ABIO. The stock is holding its gains well. The news release may attract more buyers overnight, and I can sell at a higher price." The next morning, if the stock trades at $19, they will make a profit of $9 per share in less than 12 hours. Meanwhile, breakout traders, who follow chatroom alerts, are also observing these developments.
Penny Stock Market Psychology Analysis: Putting All the Puzzles Together
Let's now combine these aspects of swing traders, breakout traders, and short sellers to complete the picture.
What happened the night before?
Common strategies for day trading in chat rooms often involve buying breakouts of previous-day highs or premarket highs.
As previously mentioned, short sellers were piling in around $12.80 the day before, possibly holding overnight, anticipating the stock might sell off further down to $5. However, when they saw a $7 drop per share, they might panic and buy to cover immediately when the market opens.
Swing traders piled up the stocks overnight, thinking the stock would rise to higher highs due to the news release.
What happened the next morning?

The price climbed up to $19.5.
Swing traders who have profited $9 a share overnight are likely to sell at the market open, taking their 90% ROI to secure profits.
Breakout traders in penny stock chat rooms may be alerted to buy at the premarket high of $19.50 and sell at $20. At market open, they and short sellers are buying to cover, pushing the stock from $18.30 to just over $20.45.
Understanding the player’s intention better than the pattern
Many believe understanding market patterns is key to day trading penny stocks. However, it's not about the market, but the other players in it. Hence, day trading psychology is essential. Thinking about the other players' actions and trading based on those, rather than just chart patterns, can set you apart.
Takeaway: Rather than memorizing patterns, understand the stock's players and their actions that form the current pattern and price action.
Penny Stock Trading Strategy using VWAP
Now that you've gotten the hang of basic market psychology, it's time to roll up your sleeves and dive into the heart of the action! Let me introduce you to a nifty little penny stock indicator known as VWAP. We'll explore what it is and how you can use it to spice up your trading.
What is VWAP?
VWAP, or Volume Weighted Average Price, is a trading strategy often used in penny stocks trading. It's a technical analysis tool that combines both price and volume to provide a measure of the average price a stock has traded at over the day. It's often used as a benchmark by traders and market makers and can be a powerful indicator for trade entry and exit points.
How does VWAP Trading Strategy work?
The VWAP Trading Strategy is a must-have tool in your pocket. It gives you a detailed look at a stock's price action by considering both volume and price.
Basically, it's like getting the average price at which a stock has been traded throughout the day, taking into account the volume of stocks traded and the price they were traded at.
You can use the VWAP line as a handy reference to spot potential support and resistance levels. If a stock is trading above its VWAP, it might be on an upward trend, while a stock trading below its VWAP might be on a bit of a downward slope.
VWAP Indicator Trading Strategy: 3 Golden Tips
VWAP is a very powerful indicator because it takes both price and volume into account in its calculations. It's not like moving averages like EMAs and SMAs, where the formulas only average out the price.
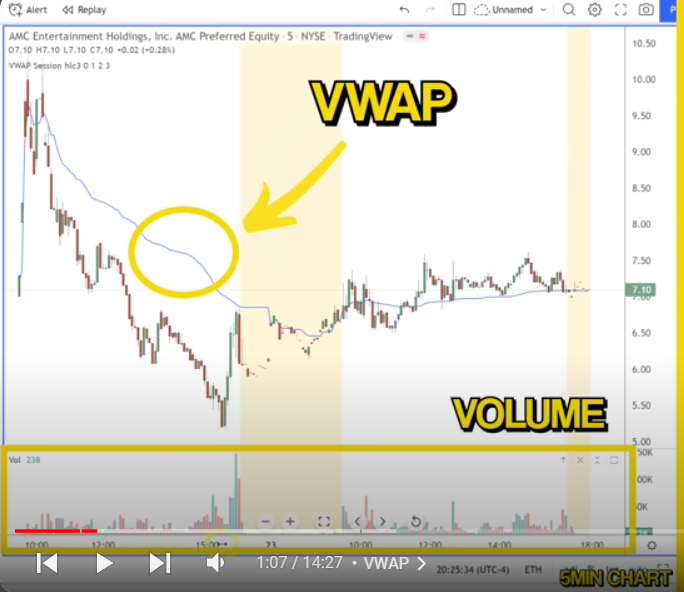
Most of you guys probably know by now that I like to keep my charts very clean. All the indicators I use on my charts are in this blue line here, which you can see. This is the VWAP over here. I use VWAP and volume, and that's all I use.
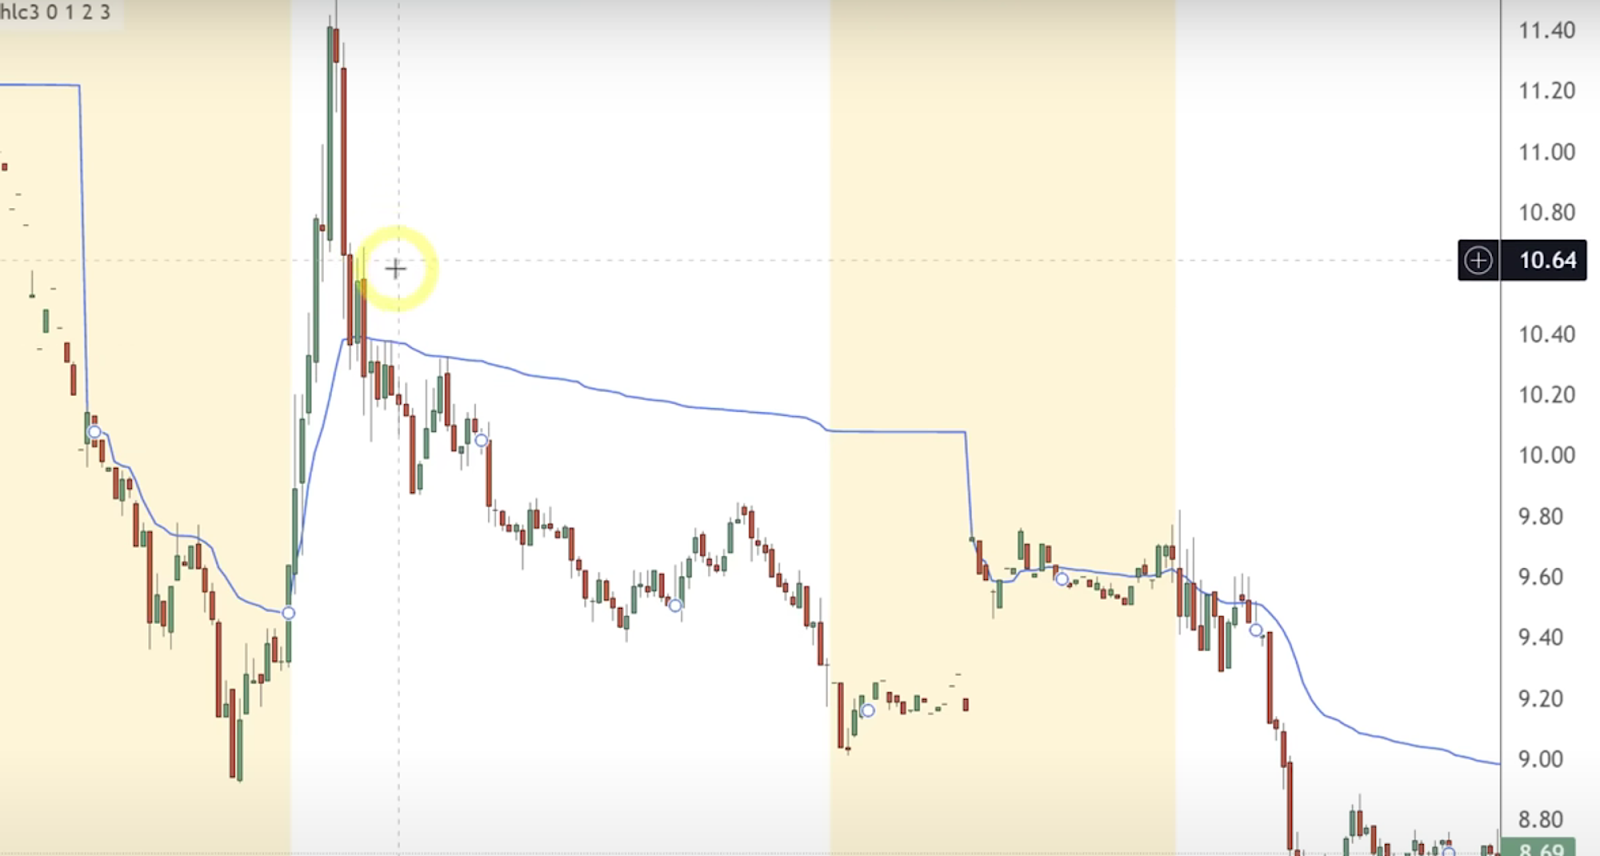
Tips #1: Trade with VWAP as the intra-day key support
So just a quick overview here.
If a stock is trading above this blue VWAP line, then the stock is perceived as bullish. That's due for a bounce. On the other hand, if it's staying below VWAP like the day IPO, you can see the stock broke down VWAP, that blue line, and stayed below it all day long. Then that's perceived as very weak.
In the most general sense, you want a short stock that's below VWAP and long stock that's holding above VWAP. So the first tip I have for you is to use VWAP as intraday key support.
| Stock Price Condition | Trading Strategy |
|---|---|
| Below VWAP | Short Stock |
| Above VWAP | Long Stock |
Here is one way to use VWAP in your long trading setup:
Find a daily breakout on the chart (applies for both small-cap and large-cap stocks)
Once the stock price breaks out, it tends to pull back to the area near VWAP indicators (indicating the breakout has a strong volume)
Then, it can be a good entry near the VWAP level.
Tips #2: Maximize profit with VWAP
Knowing how to close a trade is also an important skill in trading. Here is how you can use VWAP to close a trade:
After the long setup is done, if the stock breaks below a VWAP line and does not reclaim the position above.
Then, it could be a signal to close the trade.
Tips #3: Trade with VWAP to Spot Short Traps Consolidations
Now, let's move on to the third and final tip, which is using VWAP to spot short-trap consolidations. These are situations where the stock seems to be breaking down below VWAP, but it's actually a trap and the stock quickly reverses and squeezes higher.
This typically happens when a stock is consolidating just below the VWAP line, giving the illusion that it's weak, but the stock is actually accumulating for the next move up.
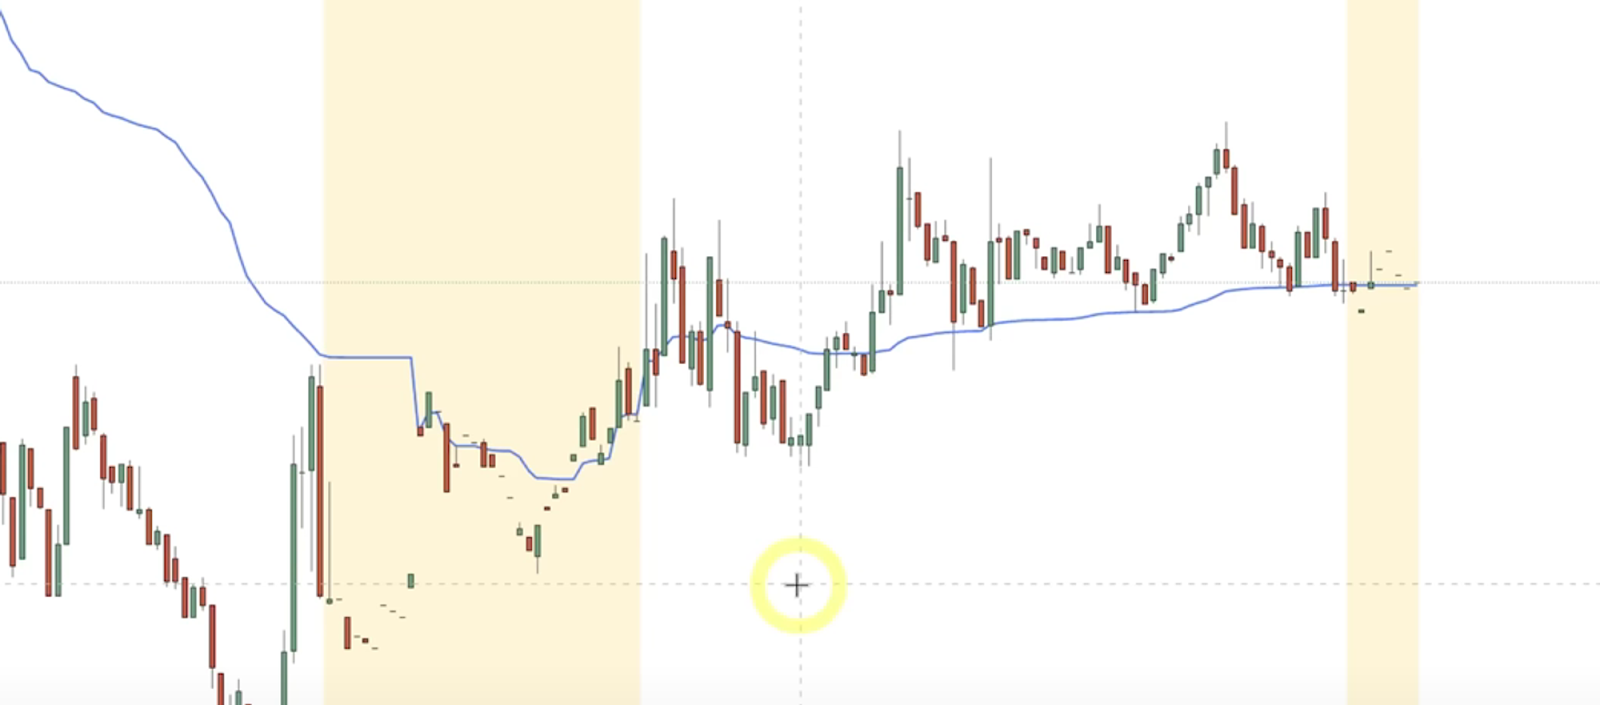
To illustrate this, let's look at the stock FCEL. You can see it was initially weak in the morning, broke down the VWAP, but started to consolidate just below the VWAP. Many traders might perceive this as a weakness and start to short the stock. However, if you observe closely, the stock is making higher lows during the consolidation, which is a bullish sign. Then, it broke above VWAP and squeezed all the shorts, causing a fast move up.
So, the key here is to be patient and observe the price action carefully. Don't just short a stock because it's below VWAP. Look for signs of accumulation, like higher lows during consolidation.
In summary, VWAP is a powerful tool that you can use in your trading strategy. It can act as a key level of support or resistance, help you maximize your profit by identifying strong and weak stocks, and spot short trap consolidations. But like any other tool, it's not foolproof and should be used in conjunction with other technical analysis tools and sound risk management strategies.
Does VWAP strategy work?
Yes, the VWAP strategy can be quite effective when used correctly. It can help identify strong entry and exit points, and provide insights into market trends. However, like all strategies, its effectiveness largely depends on the trader's ability to interpret and apply it correctly. It's also crucial to remember that VWAP is only one of many tools that traders use, and it should be used in conjunction with other strategies and indicators.
Is VWAP better than EMA? VWAP vs EMA indicator
Just wanted to clarify that it's not about one being "better" than the other. VWAP and EMA are just different tools used for different purposes. Think of VWAP as giving you an intraday snapshot of the average price a stock is trading at, relative to its volume. On the flip side, an Exponential Moving Average (EMA) gives a weighted average of a stock's price over a certain period, but with more emphasis on recent prices. So, it's like EMA offers a longer-term perspective.
In the trading world, these two indicators are often used together to get a more complete picture of how a stock is behaving. So, it’s not about which tool is better.
Essential Tips to Trade Penny Stocks
Understanding Market Cycles
The key to growing a small trading account was learning to navigate the cycle and flow of the market. I realized that small-cap stocks generally prosper during specific periods, such as March to April and October to December. That’s when you should spend more time on penny stocks.
When small caps are at a lull, I pivot my attention to mid and large caps, which offer a wider range and volume of trades and you can adapt to the market situations.
Leveraging Trader Psychology
Trading penny stocks is less about following the herd and more about understanding the mindset of your fellow traders. The trick is not to get swept up in the crowd or alerts but instead, position yourself against less informed traders in the small-cap penny stocks market. If you're not careful, you could end up being the uninformed money on the table.
Zeroing in on a Few Penny Stocks
What truly made a difference was restricting my focus to one or two promising penny stock long setups. But the real secret sauce is only hunting for these small-cap stocks when the market conditions are ripe. The reason is that most novice traders just starting only have the portfolio size to buy or go long on stocks.
Don’t Look for the Perfect Setups
The biggest misconception I’ve seen in many beginner-day traders is that they are always on the quest to find the best penny stock trading strategies, penny stock patterns, indicators, etc. What most fail to realize is that those things only work, if the market uses them. So, there aren’t perfect setups because different players in the market are making different decisions in the market.
Conclusion: No one-size-fits-all strategy for day trading
As you embark on your penny stocks trading journey, remember that understanding market psychology and using tools such as VWAP can greatly enhance your trading strategy. However, the most crucial aspect is to constantly learn and adapt to the ever-changing market conditions. In the world of penny stocks trading, there is no one-size-fits-all strategy. You need to develop your own unique approach that suits your trading style and risk tolerance.
If you are interested in learning to build a solid foundation for your trading, we’d love to have you join the Humbled Trader Community, where all my more than 8 years of trading strategies and knowledge will be shared. Plus, mentors will give you personal advice on your learning so you are ensured to have the best learning experience.
So, as always, we at Humbled Traders are here to offer no-BS trading knowledge for beginner traders. If you feel like supporting our work, feel free to share our videos and blogs with your friends. You're also more than welcome to join the Humbled Trader Community and become a part of our family!